


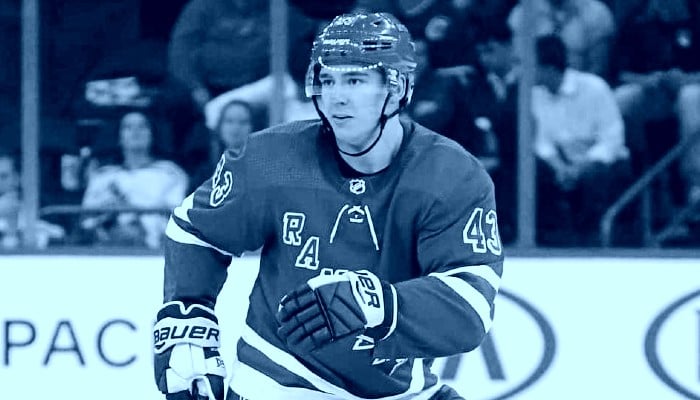


Last night the Rangers did something the franchise had never done since coming into the league in 1926 – win on the road in Game 7. Four previous attempts had ended in losses, including a triple OT and double OT loss in the early years to Boston (1939) and Detroit (1950) respectively, as well as Chicago (1971) and Philadelphia (1974).
Back in 1939 and 1950 the format of the series was a little different thanks to the circus upstaging the Rangers. In fact in 1950 they had to play 5 of the 7 games on the road, including the last three.
Things were in their current format in 1971 and 1974, but since then, the Rangers have never pushed a higher seed all the way to Game 7…until last night that is.
Last night’s victory was also impressive because it marked the first time a Rangers’ netminder has registered back to back shutouts in Games 6 and 7,and the first time in the league since Dominik Hasek did it it 2002 for the Red Wings against the Colorado Avalanche.
It was just the third time a Ranger netminder has recorded consecutive shutouts in a Best of 7 series, with Mike Richter having done it against the Islanders in 1994 and Dave Kerr against the Bruins way back in 1940. Both of those previous times the Rangers won the Stanley Cup.
Lundqvist now has 8 playoff shutouts, one ahead of Kerr who had 7, and one behind Richter who leads all Rangers with 9. In the series, he allowed just 12 goals with a .945 save percentage and a 1.65 GAA. He also moved into 17th all time and 3rd amongst goaltenders with his 56th-62nd appearances. Only Richter and Ed Giacomin have more as a Rangers netminder, and Lundqvist can catch Giacomin’s 65 as early as next Tuesday’s Game 3.
On the other side of the ice, the Washington Capitals were defeated by the Rangers in the playoffs for the second straight season. The sides have now met in 4 of the last 5 years, with the Capitals winning the first two series, and the Rangers the last two. Washington also has the dubious record of having just a 4-6 record lifetime when taking a 2-0 series lead.
For New York, it was the first time they’ve come back from a 0-2 series deficit since they beat the Montreal Canadiens in 1996. Down 0-2, they came back with four straight wins to progress to the Eastern Conference Semifinal where they lost 4-1 to the Penguins.
The Rangers earned the most power plays of any team with 28 opportunities, though San Jose – 24 in 4 games and Ottawa – 25 in 5 – both averaged more per game. The Rangers scored on just two power plays, to rank 15 out of the 16 teams in the playoffs. Only Minnesota, who went 0 for 17 in five games fared worse.
Also disappointing was the 5 on 3, where the Rangers played 3:17 to lead the league, but did not score. They also had another 23 seconds of 4 on 3 that went fruitless. 22 of the Rangers PP came in the first (12) and second (10) period.
On the PK side, New York finished in the middle of the pack, giving up 3 goals on 16 opportunities to be ranked 9th with an 81.2 percent effectiveness. Perhaps most impressively the Rangers averaged the fewest number of PKs per game, and gave up no power plays in Game 6.
Netting out the special teams, the Rangers spent 22:21 more time on the PP than the PK to lead the league in that stat.
Remarkably, the Capitals never held a lead after one period during the series, while the Rangers were 2-2 in games where they held a lead after one period, which probably was part of the reason they only lead for 34:23 – around 8 percent – of the 437:24 that was played in the series. By contrast the Rangers held the lead for 183:13, or around 42 percent, and the teams were tied the other 50 percent of the time.
During the regular season, Alexander Ovechkin scored goals regularly, suffering only two stretches of three games where he was held off the board. On both occasions the Capitals played the Rangers in the middle game of the three game stretches. In the playoffs, Ovechkin had just one goal – in Game 1 – and was kept off the board the final six.
Going into Game 7, the Rangers playing roster held a cumulative 32-6 record in Game 7s, and are now 51-6 thanks to the win. Brad Richards leads all of the Rangers with a perfect 5-0 – three of those as a Blueshirt – while Michael Del Zotto, Carl Hagelin, Chris Kreider, Ryan McDonagh, Derek Stepan and Anton Stralman are all 3-0.
Brian Boyle made it 2-0 after missing the elimination game against Ottawa last season due to a concussion, and Game 7 debutants Derick Brassard, Derek Dorsett, Steve Eminger, John Moore, Rick Nash and Mats Zuccarello all picked up their first win. Taylor Pyatt was the only Ranger who had a losing record in Game 7s, but now sits at a 2-2 record.
Pyatt and Del Zotto scored their second career goals in Game 7s, whilst Ryan Callahan and Arron Asham scored their first. Zuccarello not only scored his first Game 7 goal, but his first playoff goal in his 8th appearance. Zuccarello did have 4 assists tho, and is averaging 0.63 points per game.
Brassard and Moore made their playoff debuts, and both picked up their first points during the series. Brassard ended up leading the Rangers with 9 points – 2 goals and 7 assists – and is tied for third in the league, behind Boston’s David Krejci (13) and Pittsburgh’s Evgeni Malkin (11).
Hagelin also picked up his first playoff career goal in Game 1, and added another in Game 4, after being goalless in 17 playoff games last year during his rookie season.
The four top scorers for the Rangers during the regular season – Stepan, Nash, Richards and Callahan – accounted for just four of the Rangers’ 16 goals. The 16 goals scored at 2.29 goals per game, ranks the Rangers 10th amongst the 16 playoff teams, only the Los Angeles Kings have a lower average and progressed to the Semifinals.
New York outscored the Capitals 5-1 in the first period, and 6-2 in the third, were outscored 7-5 in the second and 2-0 in overtime. Perhaps that long change was more problematic than expected.
Before the offensive explosion in Game 7, the Rangers had scored just 2 goals in 197:24 of hockey on the road at an average of 0.61 goals per game.


 CAR
CAR PIT
PIT CBJ
CBJ